This post gives more details on one of the key moments for Quality Assurance in causal mapping, the bundle assessment, which is Step 6 of the coding workflow and is discussed in the companion quality assurance paper.
Causal mapping is a way of analysing qualitative data, what people say in interviews, focus groups, reports or any written source, when you want to understand what they think causes what. This post is about a problem that surfaces once you have one of these maps in front of you. Different sources, or different parts of a single source, often make similar causal claims from the same X to the same Y, sometimes reinforcing each other, sometimes pulling in opposite directions. We call that group a bundle of links. How confident should we be, across the bundle as a whole, that X really does influence Y? Up to now we have largely left that judgement to the analyst's eye. Here we sketch a more systematic way to record it.
I was inspired by a recent talk by Jewlya Lynn about a causal mapping evaluation she and her team conducted Lynn (2025), in particular how they made evaluative judgments about the overall strength or robustness of evidence for the claim that one thing influenced another. We have been working on a similar idea and Jewlya's excellent report has encouraged us to move it forward.
So what is the problem exactly?
After your initial causal mapping, you will usually end up with multiple causal claims for a given single link or path from X to Y.
The Causal Map app partly grew out of our causal mapping work with QuIP evaluations. QuIP has its own way of dealing with quality and robustness of evidence. And it works mostly with relatively homogenous data sets (similar interviews with sets of similar respondents) so "number of links" can be a ballpark proxy for "strength of connection". But when working with heterogeneous sources of evidence, this does not work. In the past we have said that it is up to the analyst to look at the claims and make their own assessment about the strength of a claim that one thing influenced another, perhaps via multiple steps. But this is quite a big ask for the analyst to look at all the information from all the causal claims each time.
Just a reminder about our terminology around "links:"
Normally, not one of these possibly hundreds or thousands of causal claims, grouped into many bundles, is incontrovertible. Sometimes we call each of these claims "evidence" but only in a weak sense of "something we could take into consideration when weighing up the validity of the claim that X causally influenced Y". Usually these links — singly or as part of bundles — have not yet passed any test at this stage or been compared to any standard.
So how can we submit our links and bundles of links to this kind of assessment?
What we can already do using existing Causal Map functionality is filter individual links. For example, we can (during or after initial coding) just add a tag doubtful for doubtful claims and exclude these from most or all visualisations using a "include tags" or "exclude tags" filter. But these judgements are based only on individual links. In actual evaluation and research practice there is a strong case for making more global assessments about the quality or robustness of the complete set of links within the bundle. So we add a new layer to the workflow and transform a map consisting of very many individual links within bundles into a map consisting just of a single links representing each bundle, each of which carries a global assessment of the quality or the business of the evidence within the original, unassessed, bundle.
This new layer can also take advantage of bundle-level summaries of judgements made at the level of individual links. When you look at a bundle of claims for X influences Y, the Causal Map app now summarises the distribution in a sub-panel of the Assessment panel: for example, reporting that in most cases conviction was neutral, with a few sources emphasising they were sure. This is helpful both as a backdrop for human judgement and as a filter (for example, exclude links where the source said they were uncertain). See Coding with and using link metadata for the mechanics.
The workflow goes from something like this (3 unassessed links):
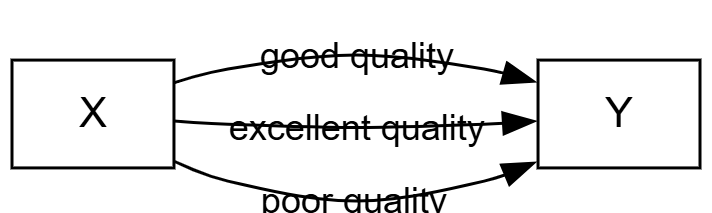
... to something like this (1 assessed link) ....
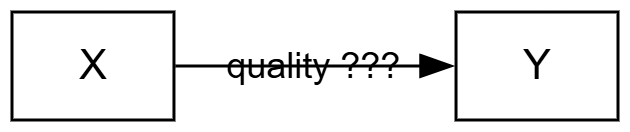
So all four links are present in the database, but we always show either the assessed links or the unassessed links.
In more detail:
- Analyst finishes coding the map (whether human coding, AI coding or some combination).
- Analyst fixes on a set of bundles to take seriously: those that survive any filters, perhaps after zooming to a higher level of the coding hierarchy or restricting to particular sources or subgroups. There might be five, fifty, or a hundred such bundles. This is the data that the rest of the analysis rests on.
- Analyst considers each bundle (including bundles that might contain only one link) and judges the quality or strength of the evidence, by hand or with AI assistance plus review.
- Analyst collapses the bundle into a single new "assessed link" carrying one or more quality assessments. The assessed link is a new type of object in the links database. By default it inherits the citation count and source count of the underlying bundle, and can carry additional scores from custom columns. In the simplest case the assessment could be:
- Robust yes/no
- or: Robustness 1-5
- Some bundles will not yield an assessed link at all, because the evidence is too thin. You can either skip the bundle (creating no assessed link) or create one with a custom column "Passed?" set to "Fail".
- For each bundle, then, there is a set of (usually multiple) unassessed links and at most one assessed link. From now on you will normally view either the assessed links or (less often) the unassessed links.
- Analyst uses the existing links table, pivot tables and/or map formatting to display these assessed links. Most obviously, they can show overall maps with only the quality-assessed links, formatted according to quality.
It's saying this:
I the analyst have looked at this chunk of quotes and contexts for this one bundle and I vouch for the judgement that it's enough to say yes there's something real going on here.
You can page through the bundles by hand, or you can let the AI do a first pass against a rubric you supply, and then review its work. The app will not let you create assessed links, manually or with AI, until you have written your criteria into a rubric or prompt sub-panel. This is on purpose.
Unassessed view: Links table. Many links in each bundle.#
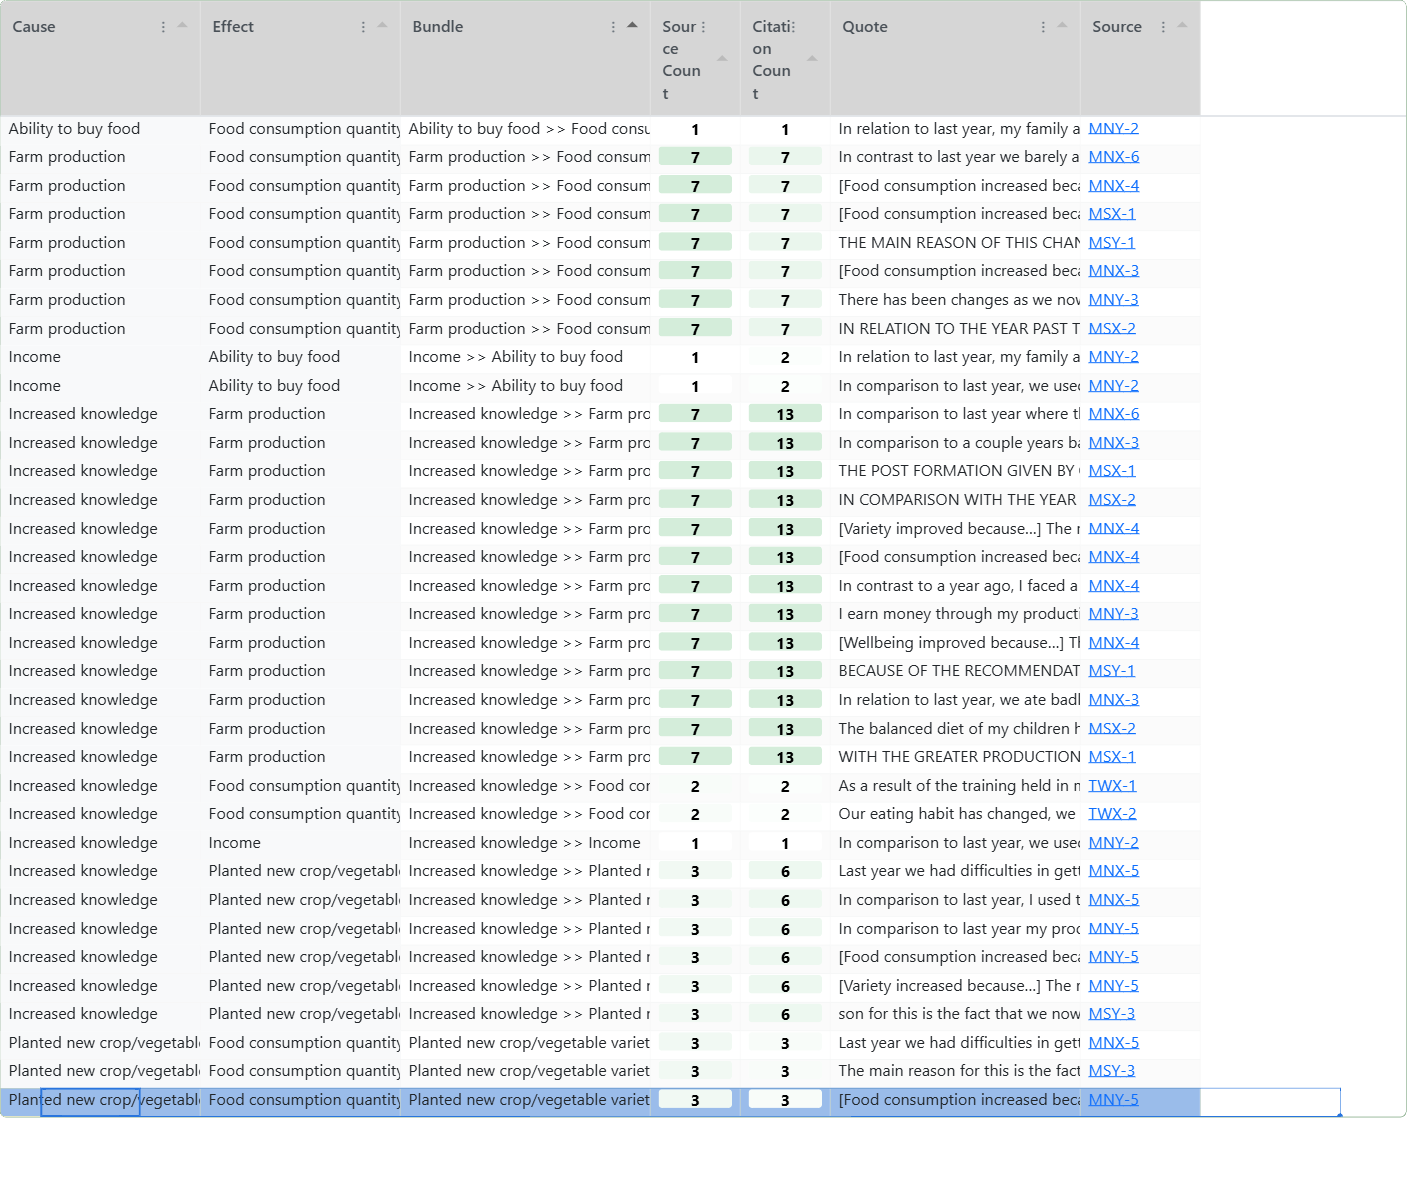 Bookmark #1485 2026-04-29 07:41_
Assessed view: Links table. One link for each unassessed bundle. Only 6 links in total.#
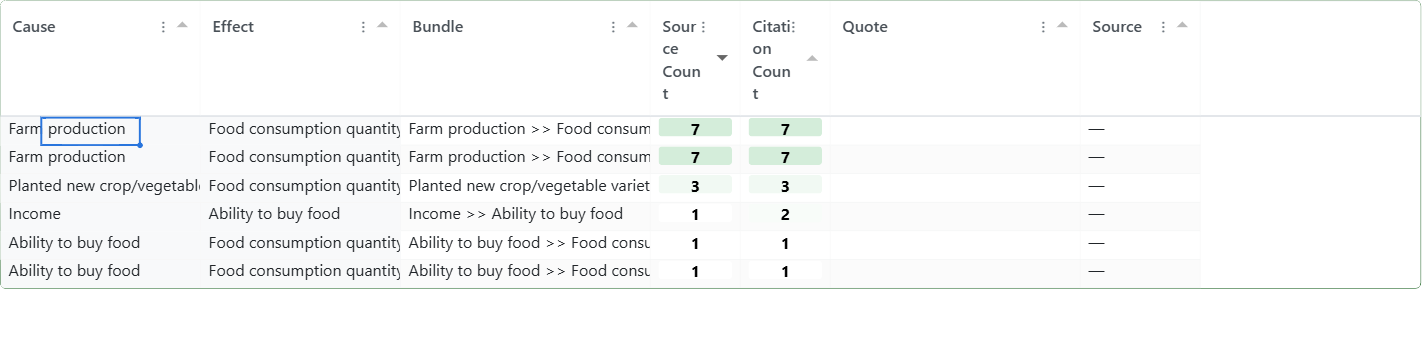 Bookmark #1484 2026-04-29 07:38_
The result is a parallel map. The unassessed claims remain in the database, but a switch in the app lets you view only the assessed links (or only the unassessed). A typical project might go from 1000 raw claims to 500 filtered claims in 30 bundles to 25 assessed links. You can use the newish "Map Custom Columns" filter to apply custom formatting to your final maps by source count, citation count, or any custom score (degree of triangulation, for example). The simpler, assessed map gives you a cleaner basis for argument than the raw claims.
The big question is of course, what criteria should we use to make these robustness or quality assessments. The answer has to be based on use: what are we actually trying to do here? We might for example want to focus on the quantity or quality or robustness of the evidence taken as a whole.
In Lynn (2025), here is the matrix which Jewlya Lynn and colleagues used.
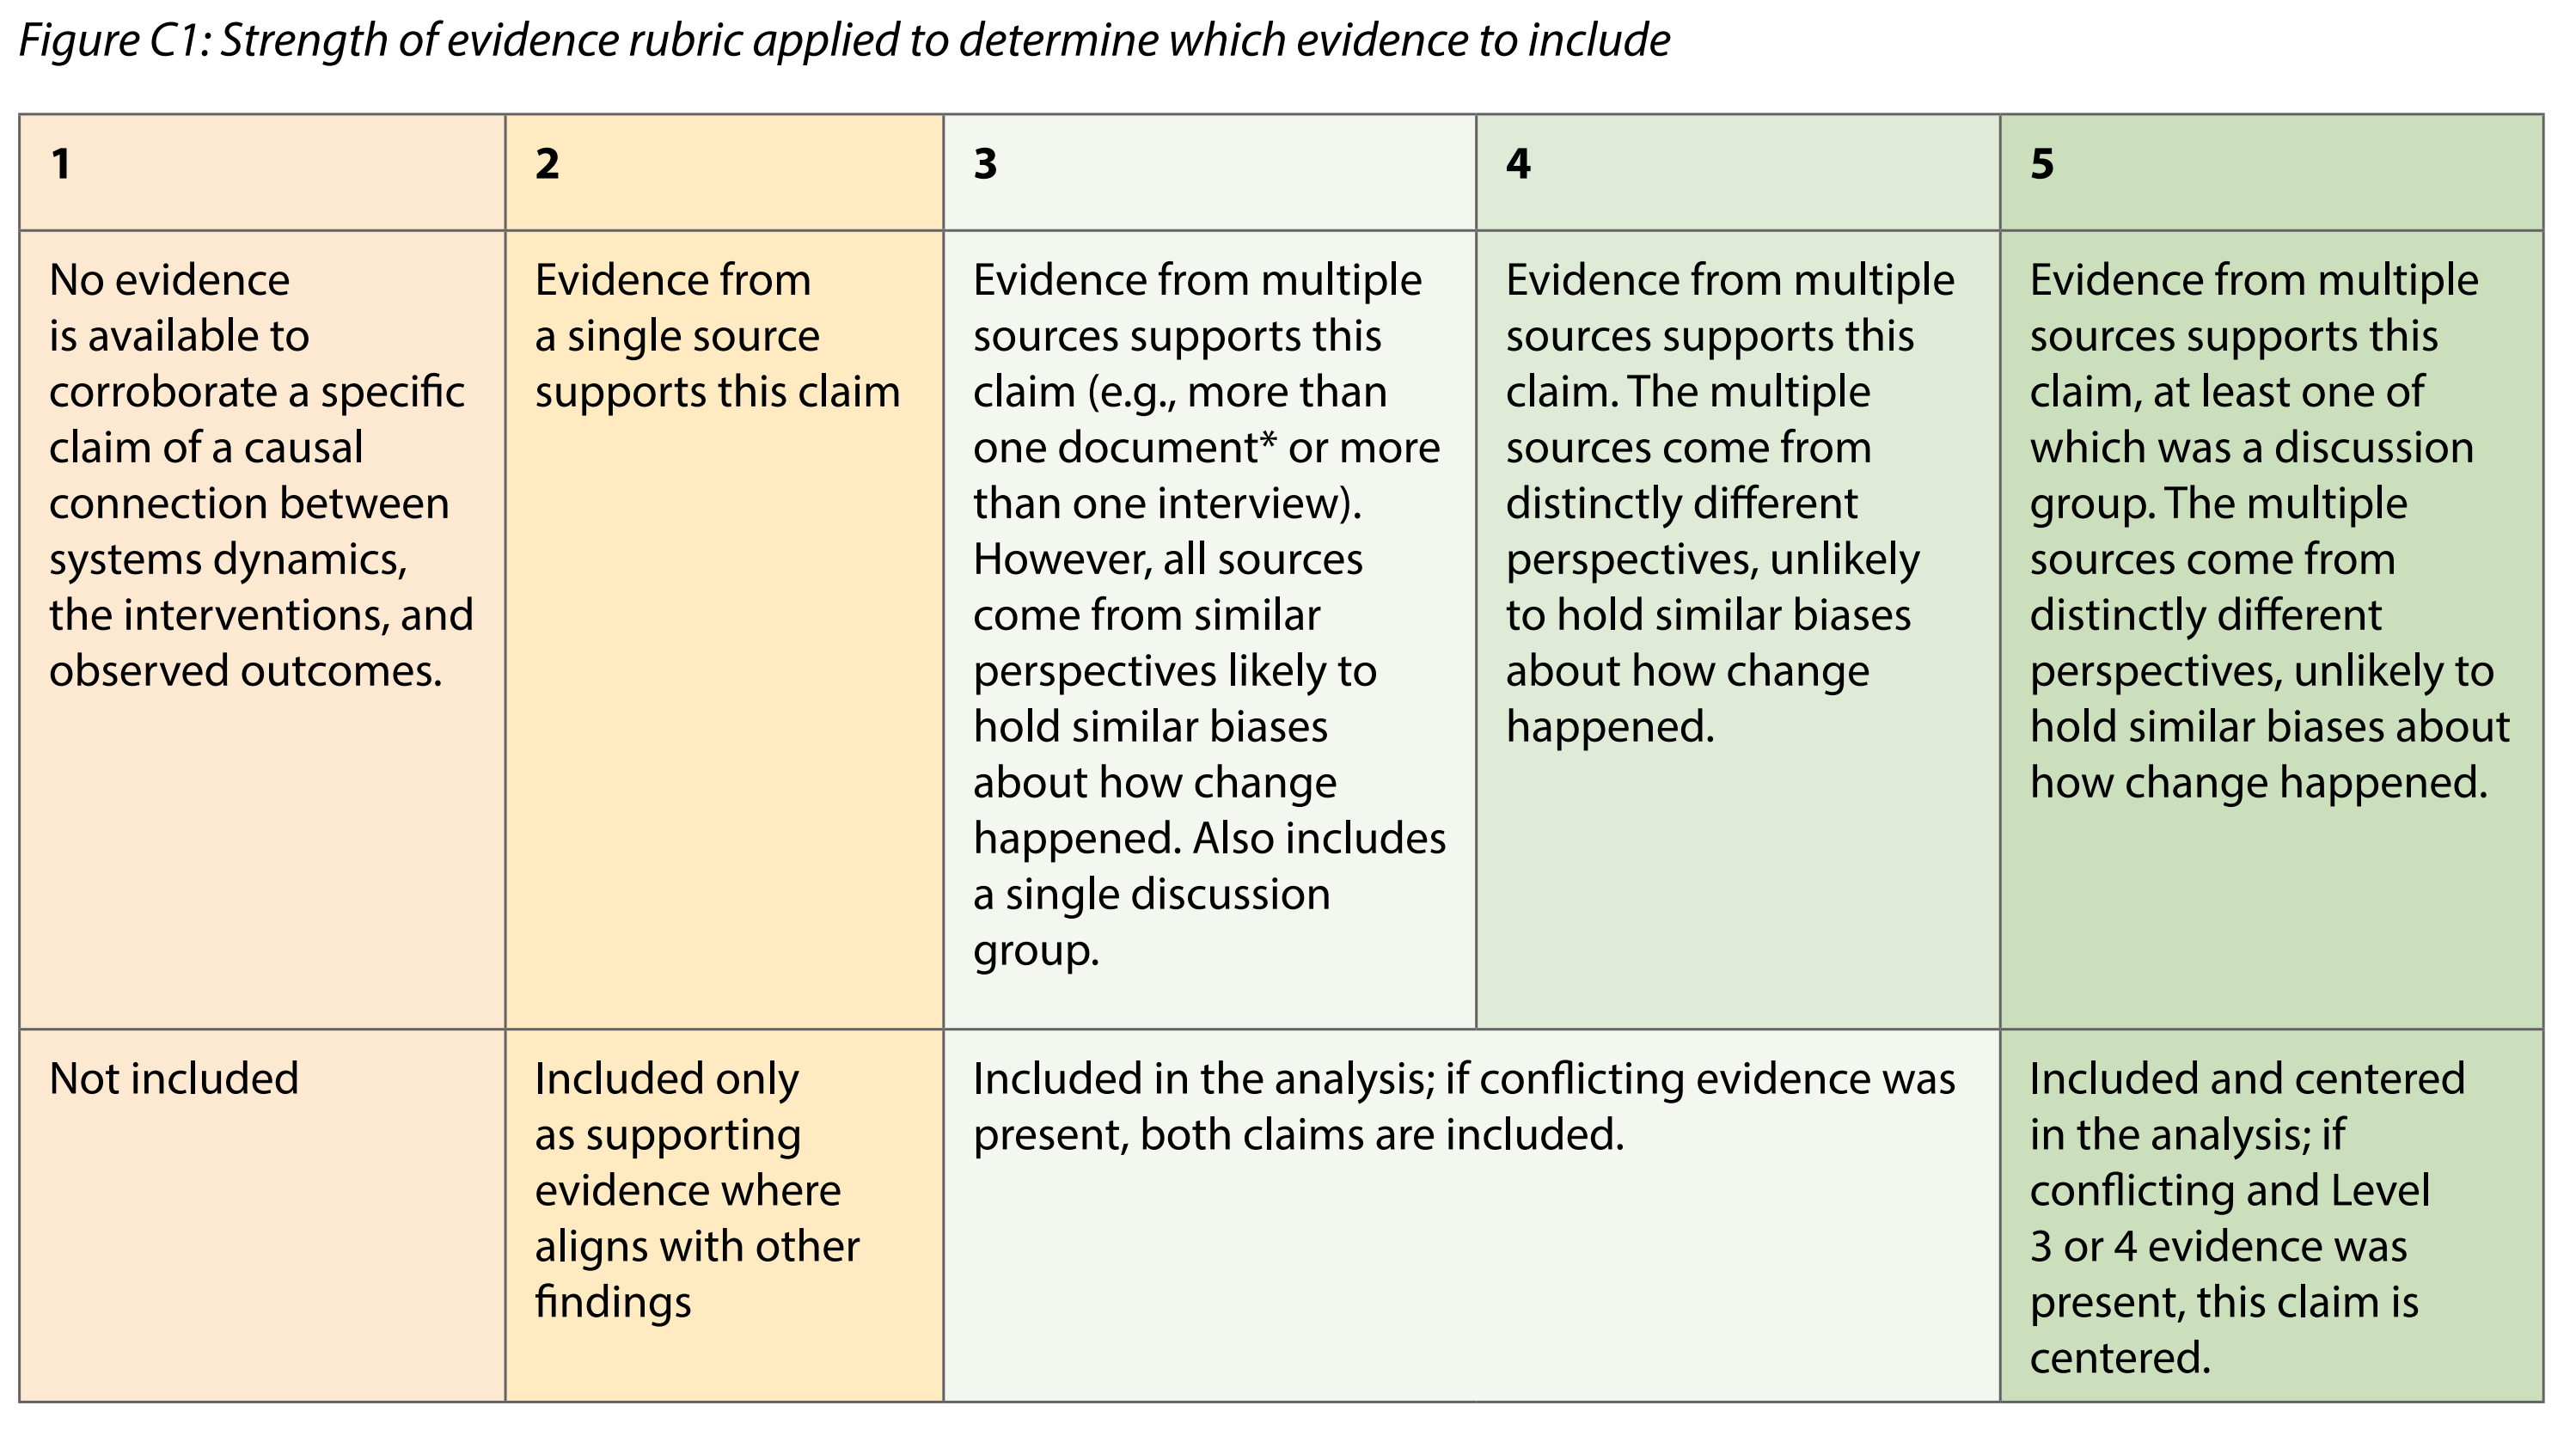 Lynn (2025)
My feeling is that, like Jewlya, we probably want to collapse all this information to just a single dimension, perhaps 1-5. Or you might want to keep multiple dimensions, for example "confidence" and "degree of triangulation". The decision is yours.
It is also possible to summarise this information not in numerical or binary form at all but simply as text judgement like "Seems solid but not really sure there is enough evidence specifically that this works for children too". This means writing into one or more text "memo" columns for the assessed links.
Noting absences#
Normally you'd add one assessed link for each bundle of Unassessed links, and in the UI you have a switch or filter to show either the one or the other, which then determines what you see in the outputs (maps and tables).
But there is nothing to stop you putting in an Assessed link for a bundle for which there are no claims at all. That is something which has been hard in Causal Map up to now.
Something else to think about#
We add these "assessed" links on a per-bundle basis. But the bundles might not contain the original cause and effect labels because we can add them also for filtered labels, e.g. after zooming or after applying soft recoding to the original labels. That means you might have a project containing a set of assessed links which are only indirectly based on the original codings.
References
Lynn (2025). HU Seafood Retrospective. https://www.policysolve.com/resources/retrospective.